The Bus Observatory is a public archive of real-time data on vehicle movements and status, collected from transit systems around the world. This free service is provided by the Jacobs Urban Tech Hub at Cornell Tech.
Fall 2025 Update: The Bus Observatory continues to collect and archive data for the New York City Transit Buses GTFS-RT feed. Other feeds have been suspended due to resource constraints. Archived data remains available for download below.
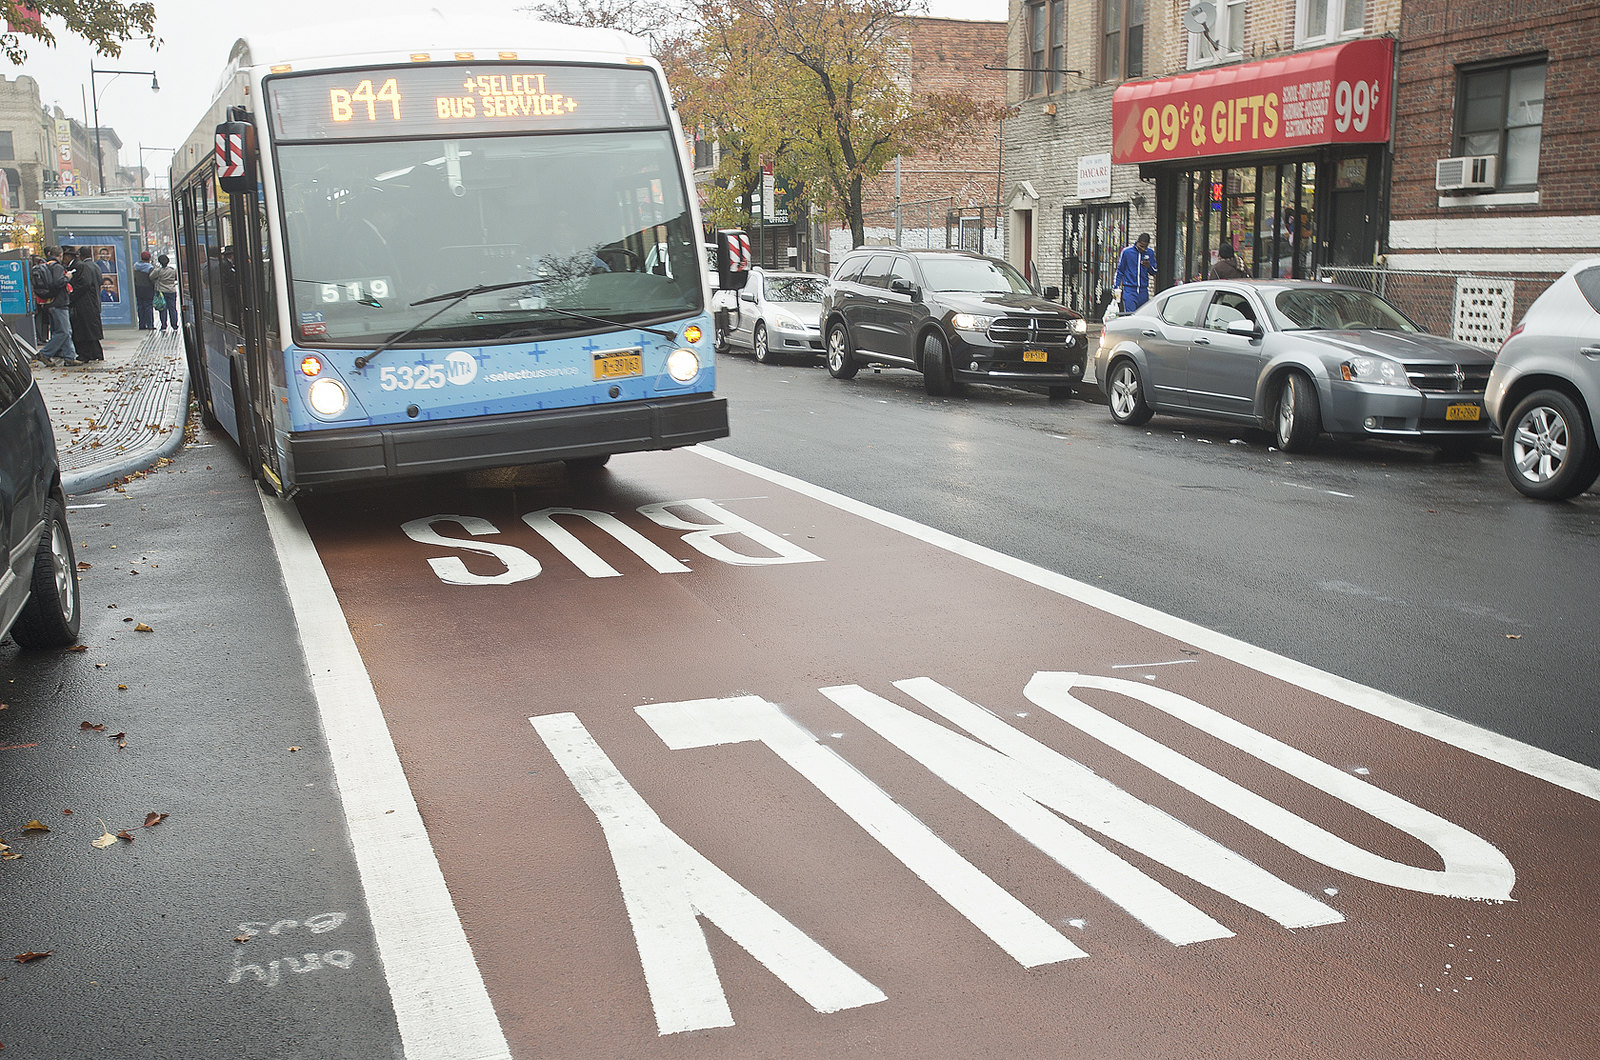
Photo: MTA / Patrick Cashin
About the Bus Observatory
Real-time transit data is valuable for travelers, helping them use services more effectively with less inconvenience. However, this data is also valuable for analyzing larger trends and issues. However, this data is ephemeral. Transit agencies lack the resources to archive and maintain logs of position data for use by the public.
The Bus Observatory, launched in 2020, seeks to fill this gap by retrieving and archiving systemwide snapshots of vehicle positions every minute, 24 hours a day, 365 days a year, for several transit systems around the world.
Our goal is to demonstrate the potential for longitudinal, cross-city studies that can inform both operations and long-term planning.
Getting Data
Overview
For each transit feed, we collect minute-by-minute observations of individual fleet vehicles' position and status—approximately 1,440 batches per 24 hour period. These observations are combined in a single Parquet file. Batches are compacted at 24-hour intervals on different schedules, with some overlap of the 24-hour clock, and do not correspond to calendar days.
Data files are stored in a public AWS S3 bucket (busobservatory-lake). Files are sorted in the feeds folder under unique names (e.g. sf_muni). Some transit systems combine bus and rail data, for others we only collect bus data.
Filenames follow the template: COMPACTED_feedname_YYYY-MM-DD_HH:MM:SS.parquet. For example COMPACTED_nyct_mta_bus_gtfsrt_2025-01-24_18:03:14.parquet contains all observed vehicle positions in the New York City Transit Buses GTFS-RT feed for the 24 hours ending at 6:03:14 PM on January 24, 2025.
1-Click Download
Browse available data by feed and date. Click on any date to download the data file directly.
Data available from to
Loading data inventory...
Error loading data inventory. Please try again later.
Direct URL Access
You can access the files directly via their URL. For example:
For GTFS-RT files, we parse all fields in the feed, including vehicle positions, trip updates, and service alerts. For other feeds (e.g. NJTransit and NYC Transit SIRI), we parse a variety of vehicle positions and status fields. Note, as of January 2025 collection of all non-GTFS-RT feeds has been suspended.
Use Cases & Examples
Researchers and analysts have used Bus Observatory data for a variety of studies and applications:
Service Analysis: Understanding bus bunching, schedule adherence, and service reliability patterns
Network Performance: Analyzing system-wide performance metrics and identifying operational improvements
Comparative Studies: Cross-city comparisons of transit operations and service delivery
Data Visualization: Creating interactive maps and dashboards to explore transit patterns
For detailed examples and methodologies, visit our Bus Watching blog on Medium, which features in-depth articles on analyzing and visualizing transit data.
License & Attribution
All data is licensed under a CC BY-NC 4.0 license. Please review the license terms before using this data.